


- © 2024 All rights reserved.
- About us
- Privacy Policy
- Terms & Conditions
- Disclaimer/DMCA
- Contact us
- Wolf

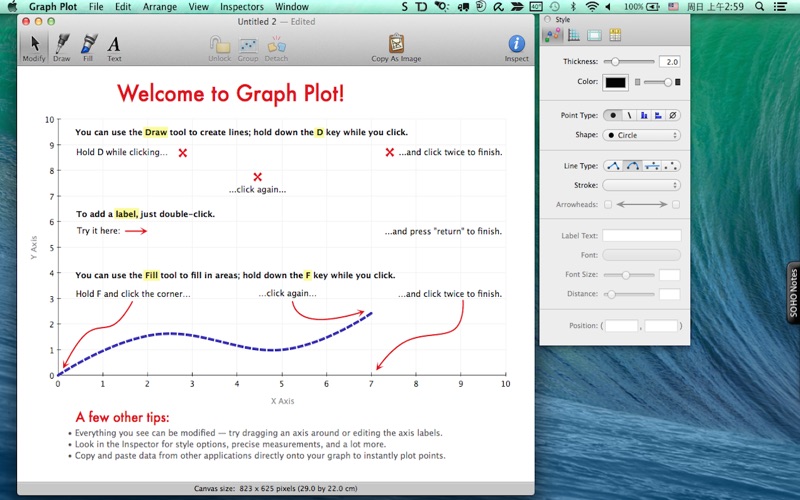
Graph Plot - Data Analysis and Plotting
Graph Plot is a software application for data analysis and...
5
|
100+ Installs
|
1 Ratings
|
$9.99
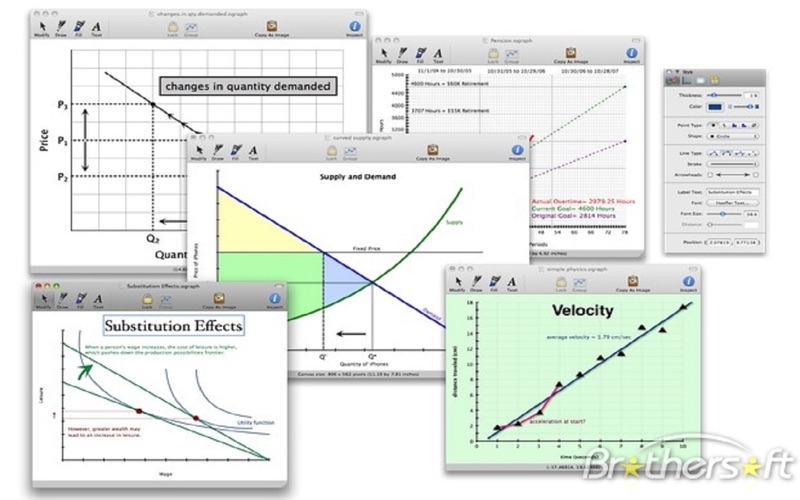
Graph Plot - Data Analysis and Plotting Screenshots


Post a Review / Comment.
Graph Plot - Data Analysis and Plotting Description
Graph Plot is a software application for data analysis and publication-quality graphing, tailored to the needs of scientists and engineers. The application offers an easy-to-use interface for beginners, and the ability for advanced users to customize analysis and graphing tasks using themes, templates, custom reports, batch processing..
Graph Plot is a software application for data analysis and publication-quality graphing, tailored to the needs of scientists and engineers. The application offers an easy-to-use interface for beginners, and the ability for advanced users to customize analysis and graphing tasks using themes, templates, custom reports, batch processing.
FEATURES:
- Graphing
With over 70 built-in graph types, makes it easy to create and customize publication quality graphs to suit your needs.
- Data Analysis
Contains powerful tools for all of your analytic needs, including peak analysis, curve fitting, statistics, and signal processing
- Maths & Simulation
For usual engineering and science applications including mathematical operations and data analysis.
- 2-D Visualization
Graphics functions to visualize, annotate and export data and many ways to create and customize various types of plots and charts.
- Optimization
Algorithms to solve constrained and unconstrained continuous and discrete optimization problems.
- Statistics
Tools to perform data analysis and modeling
Control System Design & Analysis
Standard algorithms and tools for control system study
- Export
Export Graph into multly types of formats
More Graphics & Design Apps
Most Popular

Win iPhone 13 Pro / iPad Mini 6
5.0
25K
Free